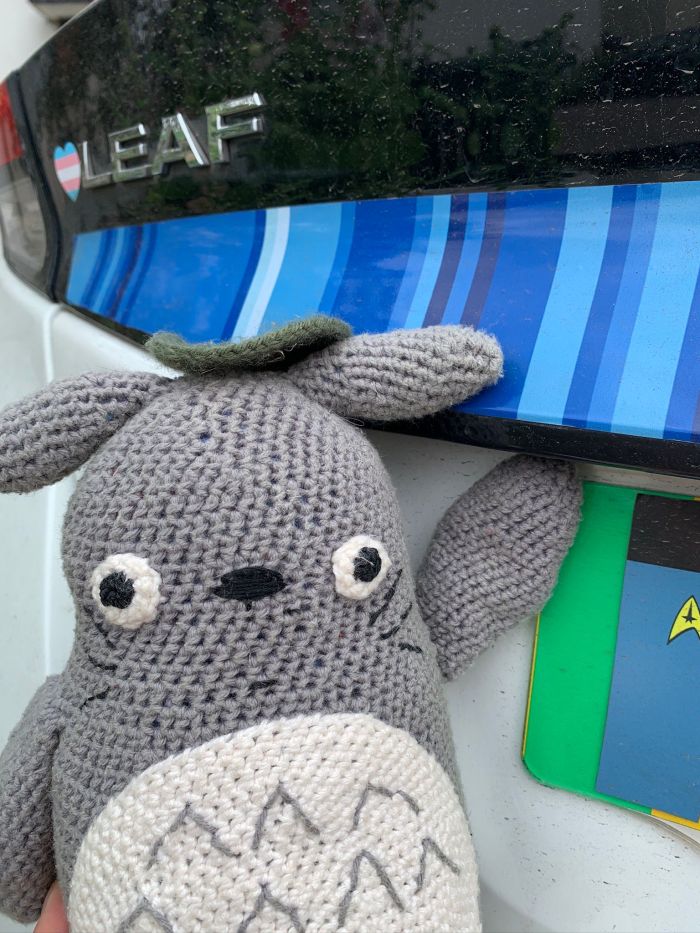
You might be here because you scanned a QR code on the back of a Nissan LEAF with some blue and red stripes across it. Or perhaps it’s 21st June and it’s #ShowYourStripesDay? Maybe you’re just curious about this colourful ‘barcode’? This page has got you covered!
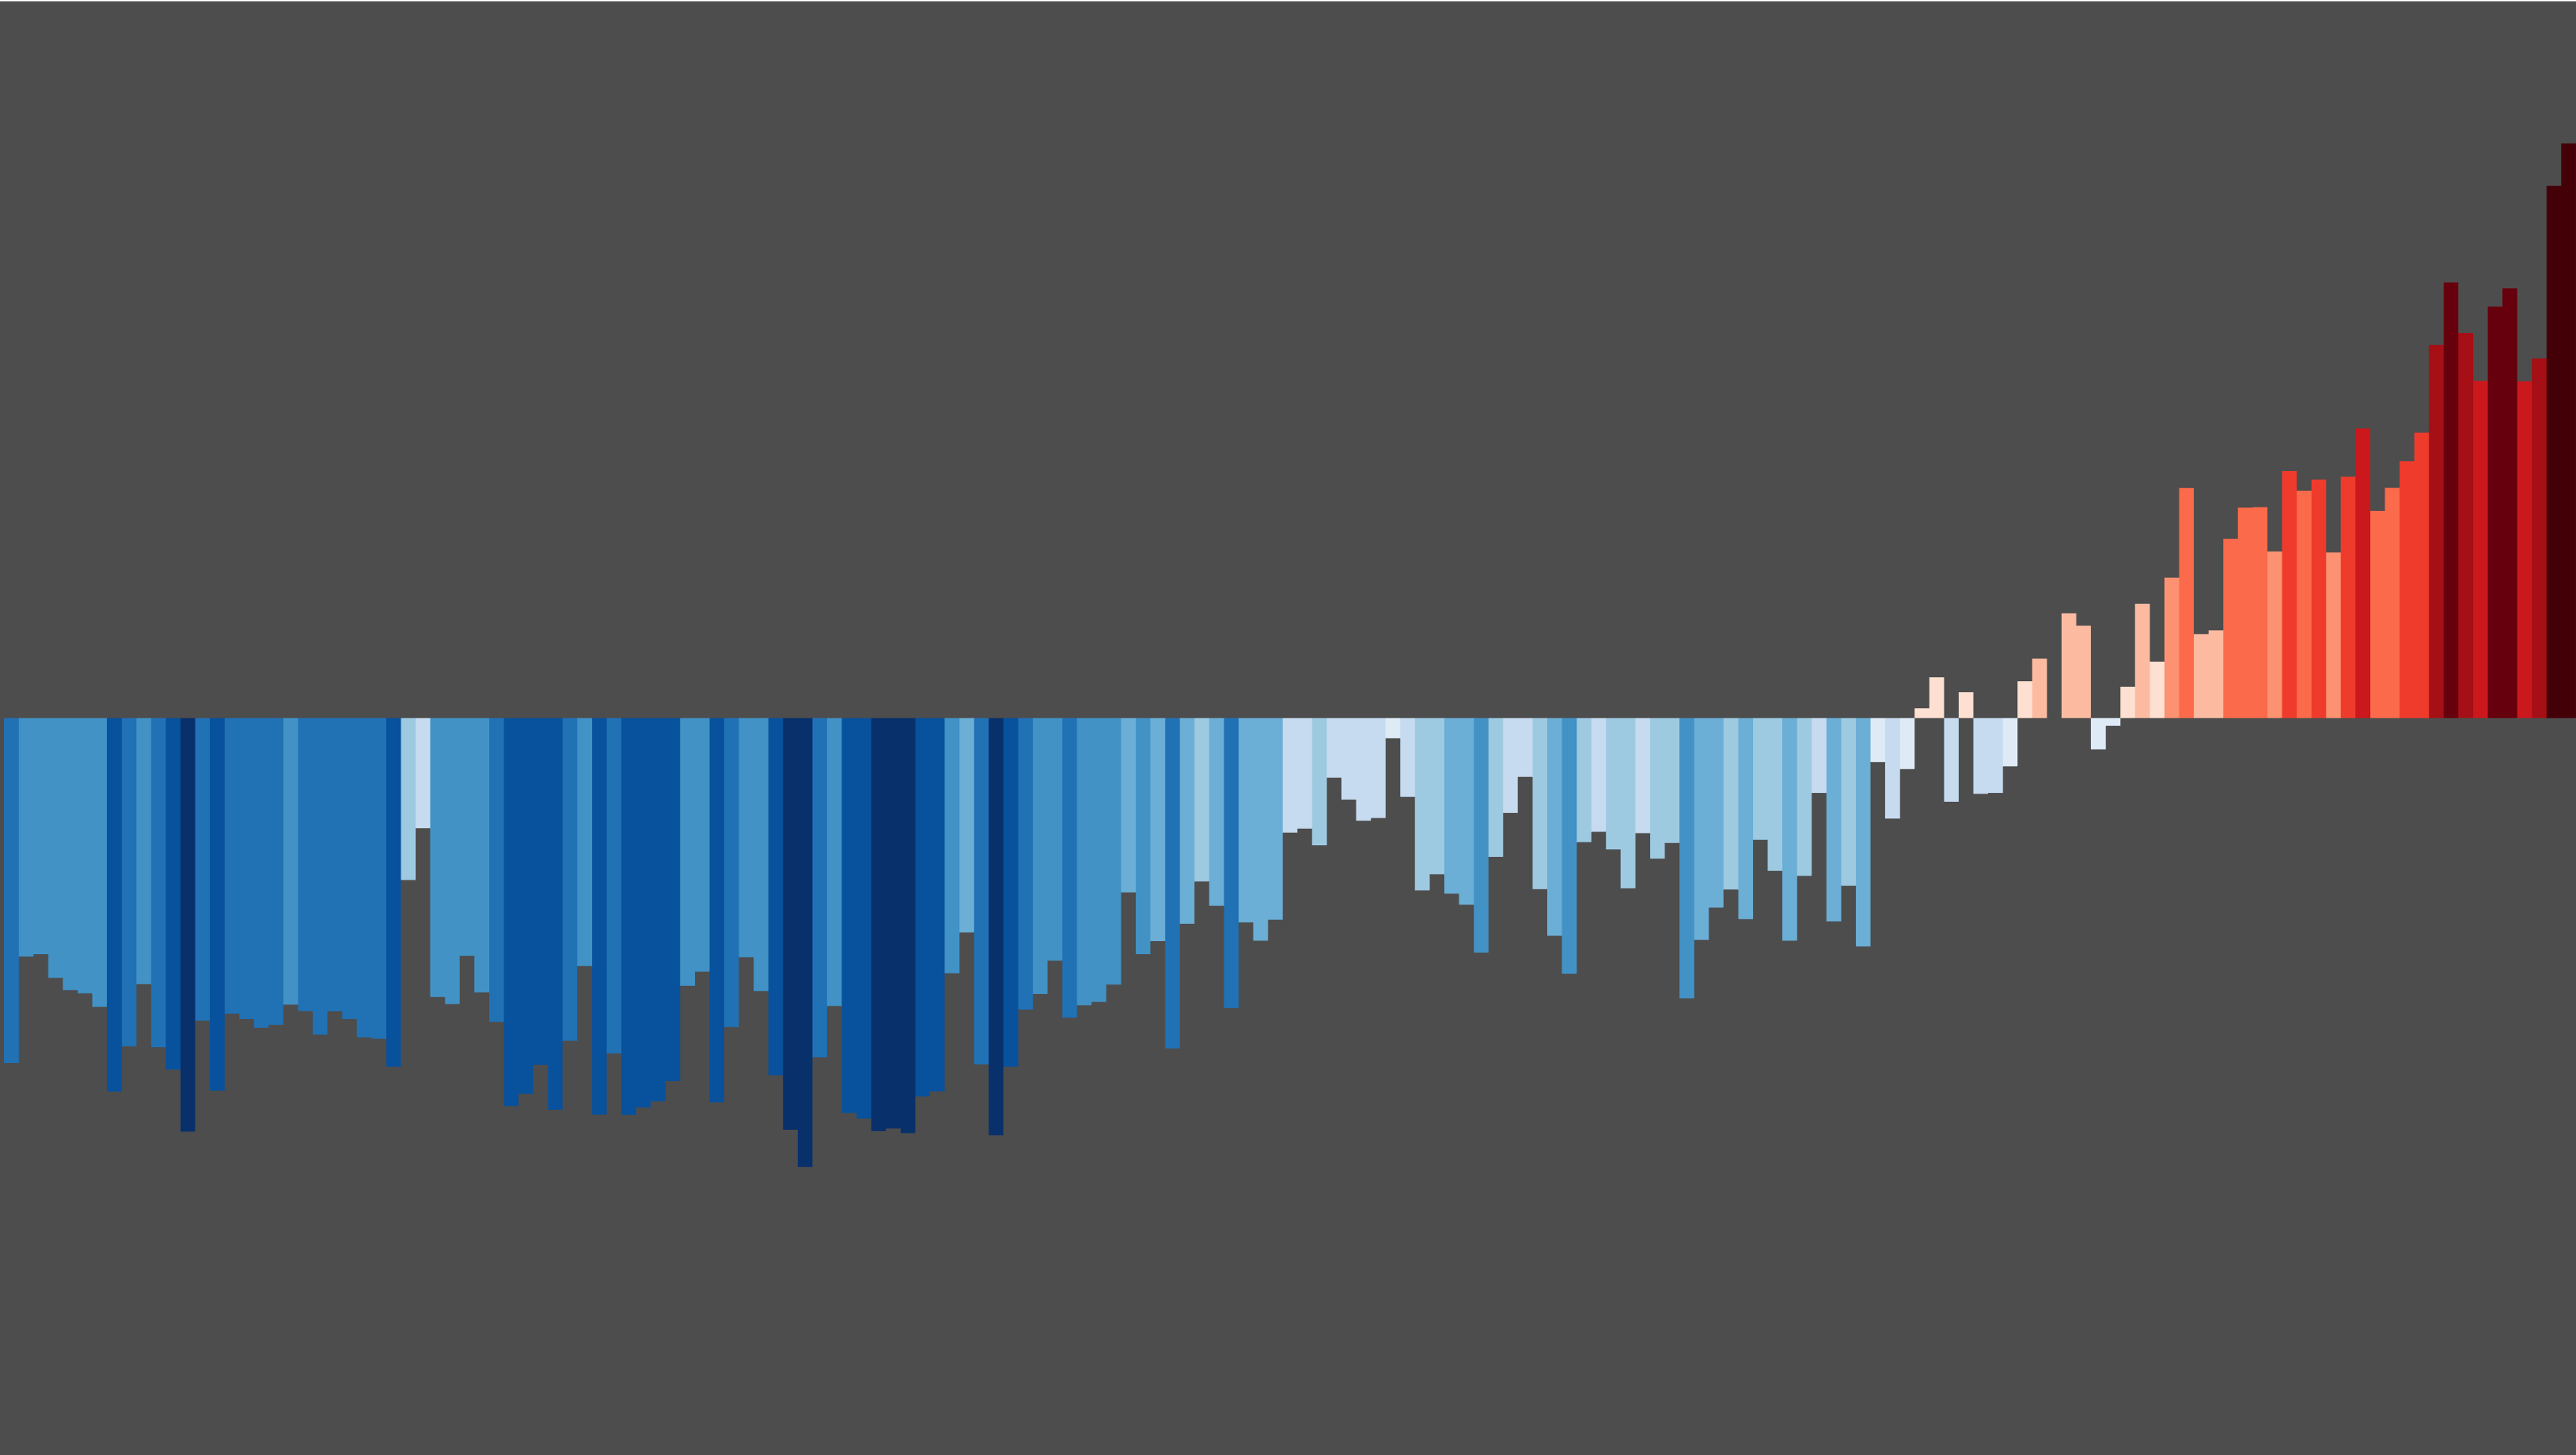
Those hypnotic blue-to-red bands you’ve seen on social media? They’re Climate/Warming Stripes – a revolutionary visualisation of global temperature changes since 1850. Created by climate scientist Ed Hawkins at the University of Reading, each stripe represents one year’s temperature compared to a 1961-2010 baseline:
🔵 Deep Blue = Much cooler than average
🔴 Deep Red = Much warmer than average

As Phil Humphries (@wychwoodgeog) explains in an Coffee & Geography Espresso episode recorded for #ShowYourStripesDay 2025:
“The warming of the climate is an abstract concept to most people. These stripes turn data into undeniable visual storytelling – cutting through the noise.”
Why Do They Matter?
1️⃣ Instant Understanding
Unlike complex graphs, the stripes reveal our climate crisis in seconds. Notice how blues more-or-less vanish after 1970? How recent years bleed into deep reds? That’s our trajectory.
2️⃣ Spark Conversations
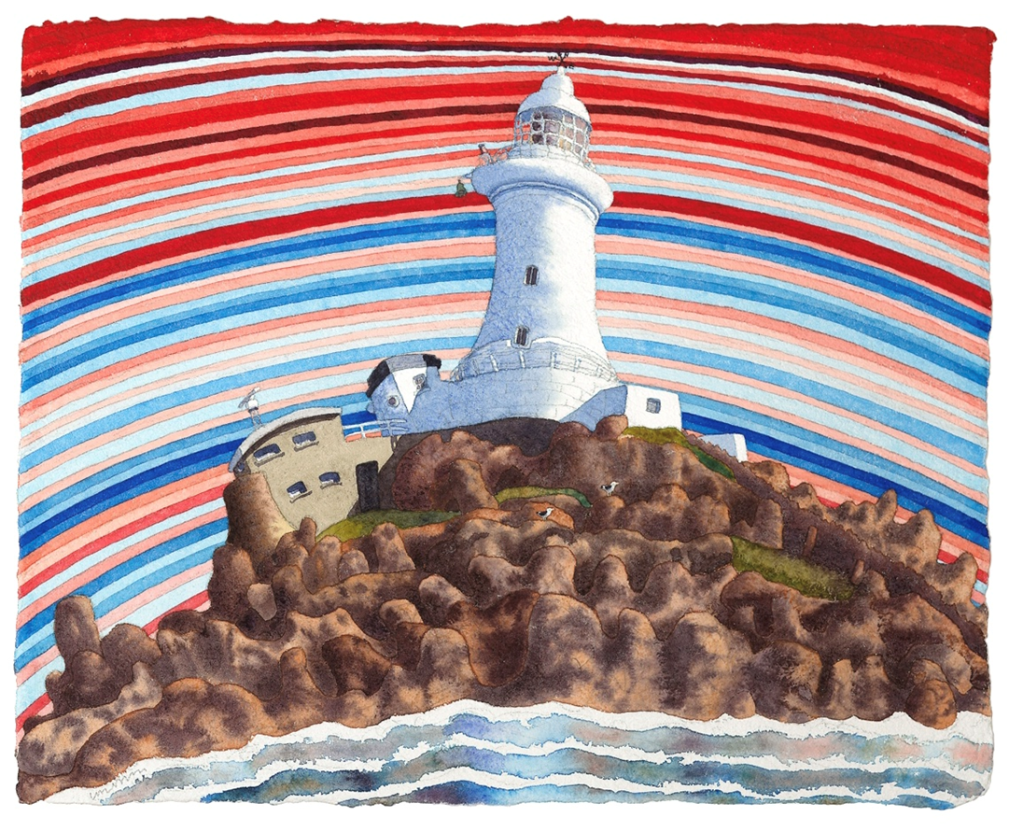
From Hay Castle to Brisbane’s bridges, projections on landmarks especially on 21st June for Show Your Stripes Day make climate science public. Phil’s school uses 3D-printed temperature blocks to show students:
“Kids see the bars growing like a climate ‘jigsaw’ – it’s bare-naked proof we need action.”
3️⃣ Replace Doom with Agency
Forget abstract “1.5°C targets.” The stripes show every fraction matters:
“Turning dark red stripes into lighter ones? That’s hope. Each paler shade means less suffering.”
How to Use the Stripes
- #ShowYourStripesDay (June 21st): Download YOUR region’s stripes at showyourstripes.info
- In Classrooms: Start climate lessons with this “non-negotiable visual” (Phil’s pro tip!)
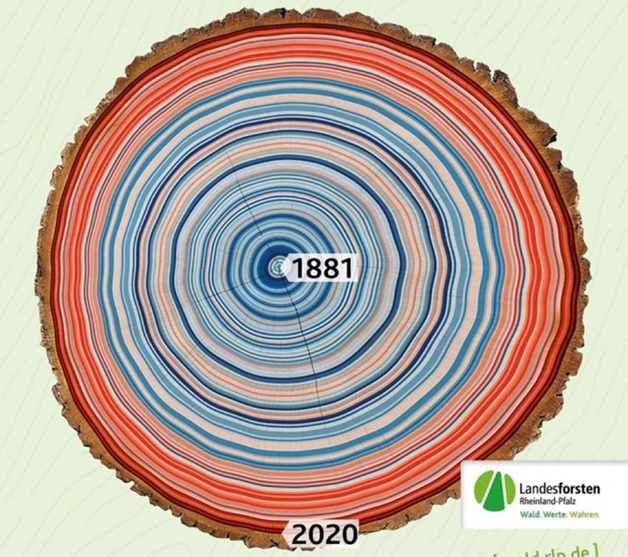
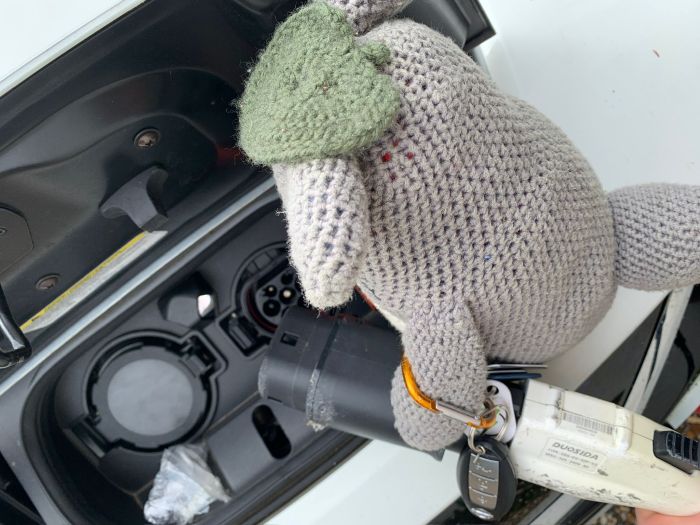
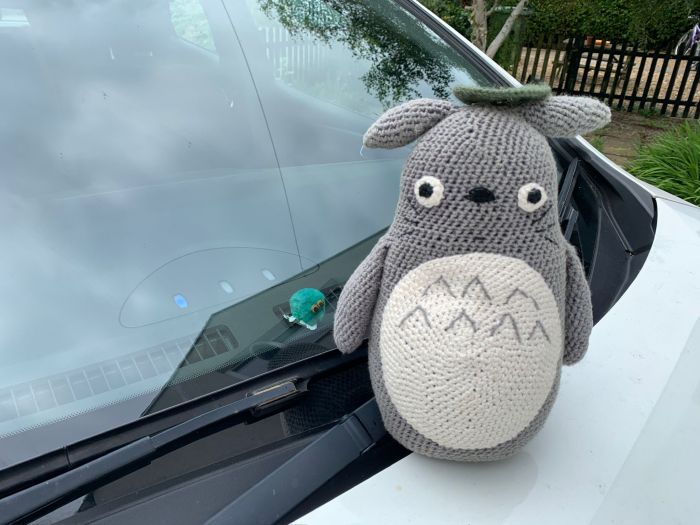
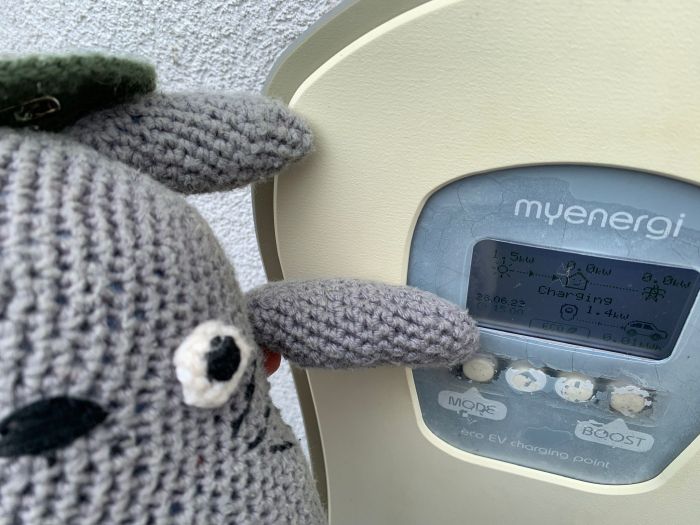
- On the Go: Think of creative ways to display your stripes. A piece of clothing? A work of art? On your car? Below are some amazing examples.


How about some story telling? Totoro want’s to show you something…

Join the Movement
Phil’s final challenge to geographers:
“We educate future change-makers. Don’t just teach stripes – use them to lighten the shade.”
3 Simple Actions Today:
- Grab your local stripes 👉 showyourstripes.info
- Share + Tag #ShowYourStripesDay and #CoffeeGeogPod
- Listen/Watch our full 15-min chat:
🎧 SoundCloud | 📺 YouTube
Every shared stripe reminds the world: Climate change isn’t a future forecast. It’s our lived story – and we can still rewrite its colors. 🌍✨
