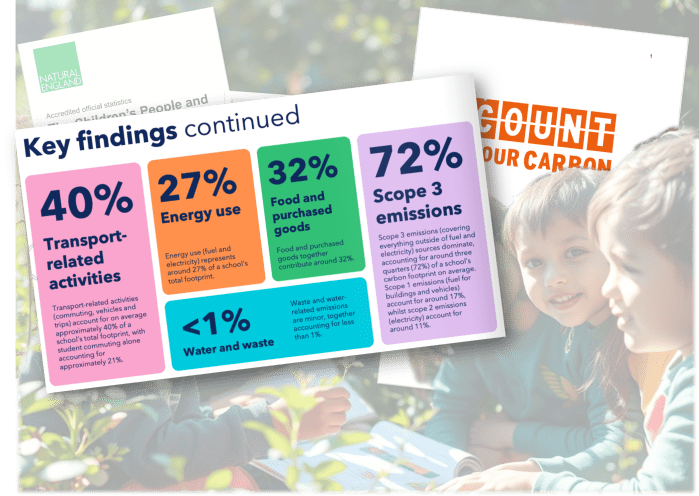
Part 3 of the "This Isn't Activism: It's a Duty of Care" series discusses the findings of the Count Your Carbon 2026 report, which analyses carbon emissions from over 1,600 schools in England. It reveals that structural decisions, such as transportation and food sourcing, significantly contribute to school emissions, often beyond children’s control. I emphasise that framing climate responsibility on students is misleading and may lead to emotional burdens, and so there is a need for institutional honesty and alignment of actions with the realities of carbon impact to support safeguarding rather than shifting blame onto young people.