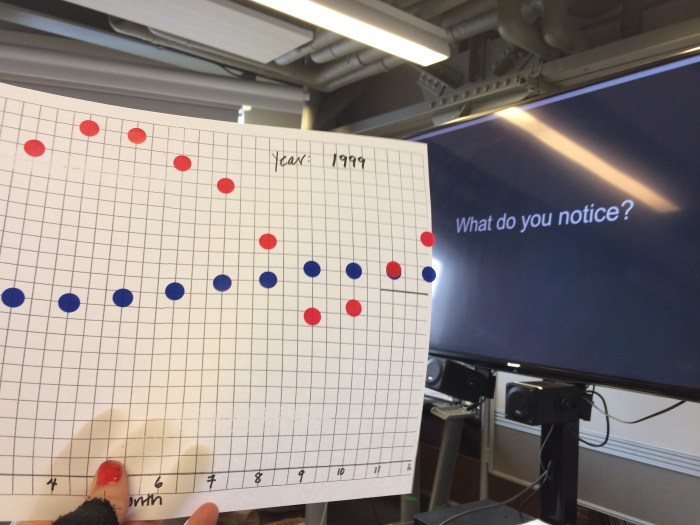
With @COP25CL #COP25 in full swing, a throwback to an #NGSS workshop by one of the talented @exploratorium Teacher Institute staff back in 2018, demonstrating a range of strategies that makes CO2 graphical data a lively conversation piece. A very useful set of resources for teaching #climatechange. Click on "View original post" to get the … Continue reading How to make a graph the talk of the town