<< GAeConf20 Part 2 – Friday 17th April
I realise that the title of this blog entry only really works if you have some measure of a cockney accent, like me – forgive my woeful pun attempt, me ‘ol chinas!
But GIS (Geographical Information Systems) has featured quite predominantly in this year’s conference – maybe since we are all conducting business through our computers at the moment is having some influence on that. Or maybe, as it’s been explained in many ways, it’s just so necessary and vital! Anyway, let’s move on…
I camped out in the Geography for sustainability pathway for the third and final day of GAConf20.
30 Reasons why geography really matters – Steve Brace, RGS
No conference would be complete without the year update to Geography subject uptake by students, and the reasons why we need to push to increase that. This could become repetitive and cliche, but Steve nails it every time he does these talks, keeping it fresh and relevant and placing the latest figures in excellent context. Here are a few highlights I picked up on.
Starting with a question which that all should consider when curriculum planning or strategising to encourage students to continue studying Geography. Have a think. How would your department approach in answering this?
Steve is very good at picking out official government documentation that could prove useful in such endeavours. Such as the Government Foresight project documents can provide you with substantiated arguments from the very top why having a geography background can be key.
And public opinion is on our side too, when asked by YouGov which GCSE subjects help their children to learn about climate change, the results are clear.

Steve thinks that the results are disappointing for the other subjects – and I agree – Maths at only 6%?! And yet so much mathematical modelling etc is used in climatology. They are missing a trick there. Personally, I’m surprised that only 74% of those polled said Geography – why is that figure not higher? (Maybe simply due to the fact that not all students opt for Geography and therefore their parents wouldn’t have named it?). In any case, we can use public opinion as a selling point.
The Higher Education Funding Council for England (Hefce) formally gave Geography at degree-level ‘part-STEM’ status. This is a huge selling point given the very overt and public push towards bringing young people in STEM. But I think there are clear arguments for Geography to be a full STEM subject, and that can help fuel passionate fires to increase uptake.
And there has been an increase in uptake, particularly at GCSE says Steve. It seems to have come mostly down to more BAME, disadvantaged and minority students making that choice. But, Steve states that this hasn’t much translated into uptake at A-Level, and so those groups of students need support to access further Geography education, often a stepping stone to higher education. Kate Stockings has done some excellent work producing resources to help the transition into A-Level – she’s an everlasting firework of great ideas, and so worth checking out and getting in contact with.
And, GIS comes up again…!

GIS is integral to daily life – everyone uses it. Throughout this conference, it’s been mentioned as an essential part of Geography. An easy win for the argument for students to take the subject is to give examples of everyday tools used by everyone (e.g. Google Maps or their GPS) and simply say “that’s GIS, by the way!”. Name-drop Will-I-Am for the double win in encouraging BAME students.
Steve also gave a push in encouraging teachers to apply for ‘Chartered Geographer’ status. This is something I’ve been longing to do for a while now, and perhaps this is the year I do it – taking advantage of current circumstances.
Our planet is changing… get me out of here! – Huw James (Anturus)
A few minutes before the kick-off of Huw James’ talk, watching him and the GA team test and set up posed a teaser for us all… looked interesting!
I could pick out so many things from Huw’s talk – he was speaking my language! Meteorology, climate, glaciers, space, Earth orbits etc… so I best recommend you catch up on the recording when it is available. Here are my highlights.
My first YAAASSS! moment came during Huw’s introduction. He talked about some of the demonstrations he has done with an audience of kids and adults too. A picture he showed of kids being thrilled by vortex rings being pumped out by a mocked-up smoke-ring cannon immediately made me think of how the Exploratorium (San Francisco) operates – to engage and thrill people as they discover the world through hands-on science and demonstrations. I got all nostalgic for that place, once again.
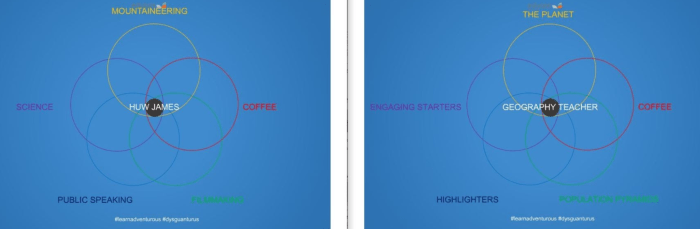
I also absolutely loved hearing about how Huw came to do what he does. He gave us this notion of identifying yourself through polymath learning. Take all the bits that you enjoy and figure out how they crossover, overlap and interlink and you may indeed find your calling. I’d replace ‘coffee’ with ‘tea’, mind you!
After a bit of a comical diversion pondering whether penguin urine does, or doesn’t make up for 3% of Antarctica’s ice…
…Huw then moved onto some practical demonstrations – one of which featured that giant model on his desk. The webcam image was a little fuzzy, but it was clearer after description that it was a paper mache model of a mountain landscape!
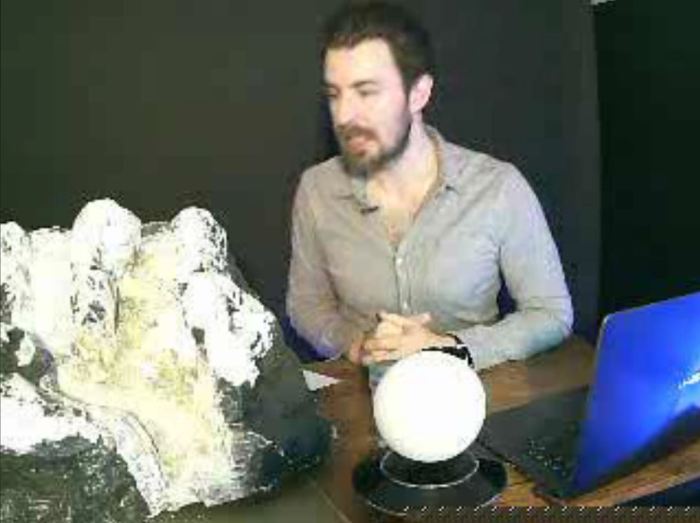
You can use corn starch to act as a glacier to carve out a landscape made of paper mache. Pour it on your model and voila! Corn starch cracks as it dries, demonstrating cavasses – could stick ‘boulders’ in it and see how they move. Check out this video from the Anturus website, and the accompanying free resource giving instructions on how to set it up yourself.
Check out the Anturus website’s ‘experiments’ page for many fantastic resources. Perhaps you have some creative students who would be willing to have a go at some of them at home?
Could Geography save the world? [Radical Geographer] Paul Turner
MOVE OVER that ‘lobby’ music that you’ve been using in between talks, GA! Paul Turner has found a better alternative… Thanks Paul, no really, thanks… *facepalm* 😉
There are so many talented geographers out there – indeed, each and every geography teacher is in some form or another – you’ve just got to find your particular groove and shout it from the rooftops. Paul is certainly one of those geography teachers who loves to challenge himself, push the boundaries and loves to bring others along for the ride. He’s a radical geographer for sure, and I pretty honoured to be considered in that company, too!
But each of us can be radical. And we need to be. Paul’s talk gave some ideas.
“We really need to be as ambitious as possible… really reflective and critical of our practice”, says Paul. Think about questions such as:
- Are we teaching climate change wrong?
- Why has progress been so slow?
- Should we be more radical in our teaching?
- How can geography facilitate a better world?
First, we should put human existence itself in context. We have been but a blip in the history of the earth and yet rapidly, to various degrees, have fundamentally changed our relationship with nature. But Paul cautioned that this is not uniform across the whole of humanity.
A lot of the narrative about human impact on the planet has been negative. What about the good news? They should be conveyed too. Our World In Data has a wealth of graphics and interactive graphs that can be used to explore ‘good news stories’, and the book ‘Factfulness’ immediately comes to mind here.

Why does the world need ‘saving’? Paul gave us some reasons. Firstly, inequality. This is a confounding problem that exacerbates many other issues. For instance, I’m of the opinion that with COVID-19 we are not, actually, “all in this together” because of inequality (see this Guardian opinion piece, worthy of discussion). In terms of carbon emissions, the richest 10% of the world produce almost 50% of CO2 emissions. Ensuring students are aware of these inequalities and know how to take responsibility from their relatively privileged positions is important.
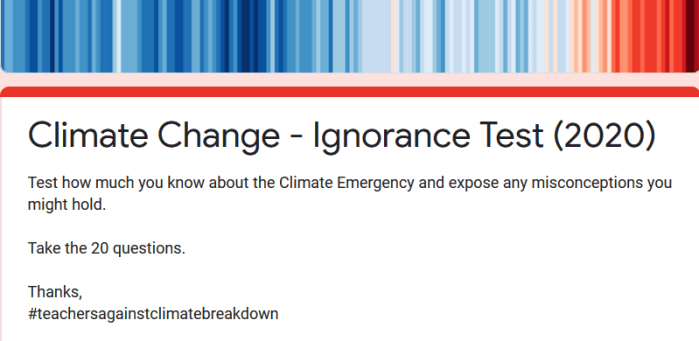
The second reason is misconception. The human race is exceptionally ignorant of itself. The Gapminder ‘ignorance test’ should be compulsory for all students to take – embed it into your KS3 scheme of work! A winner because it’s as fun as it is eye-opening. With regards to climate change, Paul and others created another version of the test. Have a go at https://bit.ly/climatechangeignorancetest.
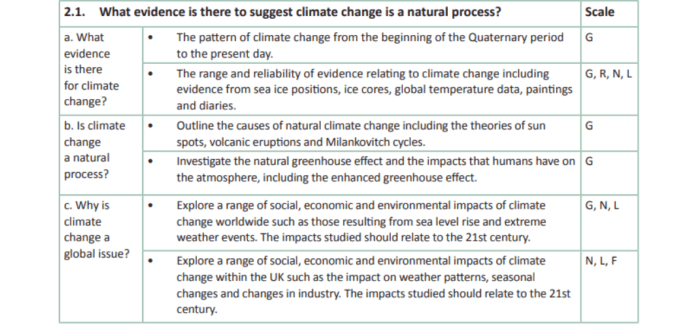
Next: Curriculum and assessment. Paul did some excellent but simple analysis here. Language is so important, looking at some of the GCSE exam syllabuses, he has discovered that the language that is often used in the exam boards is questionable and lacks what is important – too unbalanced towards the causes or processes rather than the solutions, which can help empower students with the feeling that the climate breakdown can be addressed.
It’s no wonder why students are highly anxious – as little attention is paid to solutions. In my current job, I have seen incredible work from academics and engineers in projects like Copernicus EU and Drawdown. But they aren’t being communicated. I know it’s cliche to say it – but work is already being done, and the skill, knowledge and expertise are all there to solve the climate issue – the only thing missing is political will (so students need to be aware of that, too).
So what can we geography educators do? Keeping things simple and achievable is one way – making students feel they have the power to make changes that will make a difference. Paul gave this tweet from Professor Mike Maslin as a good example through the use of emojis:
Facilitating students who which to be more actively engaged politically is another. Now, not all teachers will be comfortable doing this or indeed may feel they are unable to do so. My old school organised an in-house ‘school strike for climate’ so it was both an act of activism but also sanctioned. My argument is that schools teach about democratic rights and how protest has brought change, historically. And to a degree, climate change is a safeguarding issue.
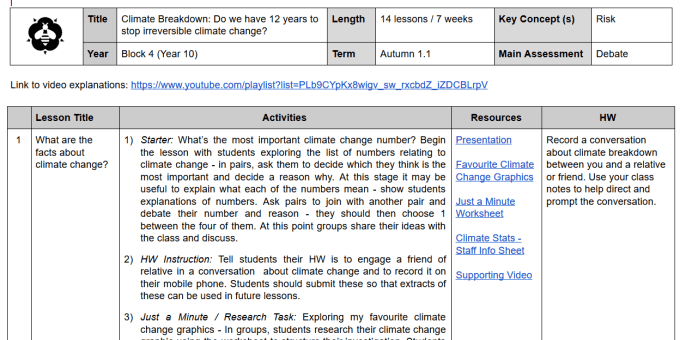
Paul has produced a 14 lesson fully-resourced ‘climate breakdown’ scheme of work and invites everyone to use, adapt, update…
I also loved hearing how Paul engages the parents of the students he teaches by getting them to come into school to see how Geography has moved on, getting away from that when I was in school all we did was maps and mountains narrative. They can see for themselves how learning and practice in the subject has changed.
So children may feel they are on a ‘conveyor belt’, as Paul puts it, but it’s our role as geography teachers to give them the agency and empower them to see the actions they can take are worthwhile and positive. Give them some levers to feel they can switch tracks, slow things down…
There was a very good question posed by one of the attendees, Katie Amey, who asked whether should students should continue to learn about climate change at home during lockdown, since it could potentially have a negative effect on their mental health in a time of high anxiety. My response in the chat is that they can learn about the many good news stories – some which I know are happening through my work. I’ll list some here for people to look at:
- The Boy Who Harnessed the Wind – A heartwarming true story about a young schoolboy in Malawi who built a wind turbine to bring power to his community. Originally a book, now a movie.
- The Wind Dial – track how much of the UK’s energy is being covered by wind
- The UK on the forefront for offshore wind farm development
- Climate Heroes – an upbeat “you can do it!” carbon calculator. Tells you what you are doing right as well as recommending other things you can do – and then you can ‘opt-in’ to commit to those actions. (I love the language on this tool)
- The cost of producing renewable energy is falling rapidly, and in some cases is cheaper than fossil fuels
- Investigate how COVID-19 is having unintended positive consequences for the environment (e.g. wildlife returning to cities, reduction in air pollution, drop in carbon emissions etc). Could we learn from one crisis to help fix another?
The discussion at the end of Paul’s talk was very vibrant and rich. There is no way I can do it justice here – the hosts confirmed that the chat text will be saved – that in itself will make for good reading. So look out for that when everything is collated post-conference.
The Geography of Slowdown – The End of the Great Acceleration: and Why it’s Good for the Planet, the Economy, and Our Lives – Danny Dorling
You’re not a true geography teacher if you haven’t heard of Danny Dorling. And even if you haven’t, you’ve probably taught a few ideas of his without knowing. The north-south divide, anyone?
Slowing down doesn’t have to be bad, and going faster and faster is not always good. We’re now in a time of slowdown, and Danny argues that this can generate change for the better. The explosion in world population growth, for instance, will never happen like it has over the past hundred years again, well, perhaps only if we colonised another planet and ‘started over’. In nature, it only really happens once with a species. Indeed you can’t keep increasing a population which relies on finite resources.
But while we’re familiar with graphs like this…
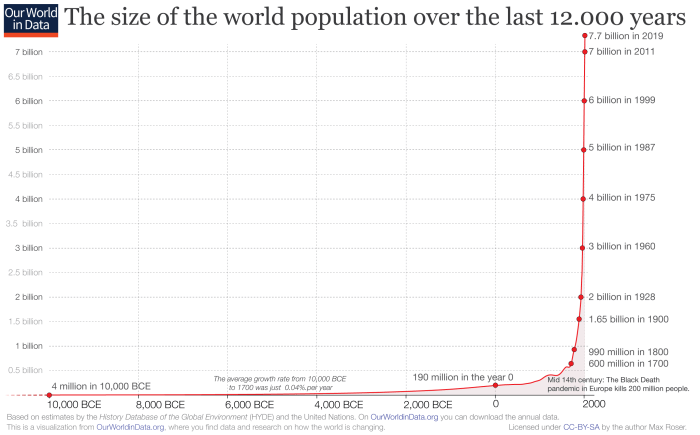
…they are in fact quite misleading. Looking at it you can see where the hysteria of a ‘population bomb’ comes from – and don’t get me wrong, population is a factor in environmental destruction (as a function of consumption) and many other issues. But the stretched out x-axis is hiding the ‘slowdown’ – the demographic change – that we know is happening now.
Danny showed us things that were once, and recently accelerating – US student debt, data (e.g. articles on Wikipedia) which are now actually slowing down using a different kind of graph – where there variable is on the y-axis, and the rate of change is on the x-axis. Here’s the Wikipedia one, for instance.

A fascinating way to look at the same data! I admit, it took me a few minutes to ‘attune’ my eyes to them, but after, I could clearly see the rapid increase in Wikipedia articles taking place between 2001 and 2006, and then that increase slows down, picks up again between 2014 and 2016 and slows down again. All the while the number of articles by year-end is increasing, but at a slowing pace.
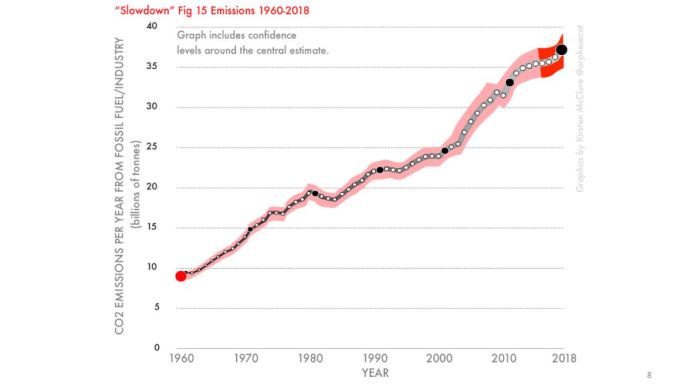
Carbon emissions, at the moment, are not slowing down – at least by the latest data. It seems that every key step forward (e.g. the Paris Agreement) humanity seems to take its ‘foot off the pedal’. Now I deliberately haven’t shown you Danny’s graph displaying the accelerations and decelerations like the one above. Here’s a ‘standard’ version instead – can you picture in your head what the acceleration graph may look like?
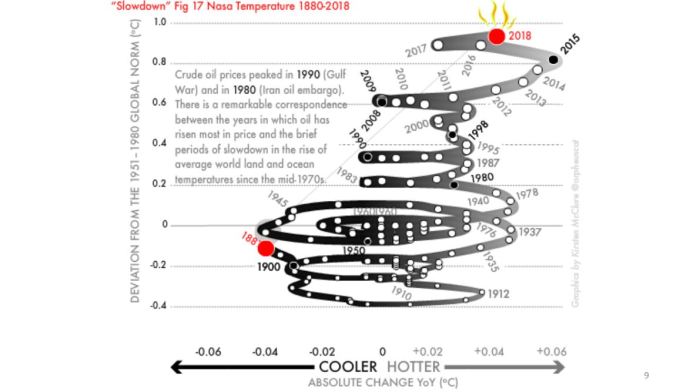
Now the next graph was really interesting for me. I have seen this exact data in so many different ways, but never like this. I have to say, this visualisation really cuts clear.
At this stage, while listening to Danny and absolutely transfixed on these ‘rates of change’ graphs, I realised I was at risk of simply giving a running commentary of his talk. But I’m choosing to resist here for a couple of reasons. One – is because you really do need to listen to Danny speak as he takes you through each visualisation to get the full message and impact, and second, because I really want to challenge you to think about what equivalent graphs may look like in your head – perhaps have a go sketching them? So go on – what about world population (see again above for the ‘standard’ one from Our World In Data)? What would a graph of total population on the y-axis, and absolute change (rate) of population on the x-axis look like, projecting towards 2100?
So – were you right? Have a look at the Slowdown website (Figure 21), and see how close you got!

Now have a little explore of those graphs, and you can see what Danny is describing as a ‘slowdown’.
You know the classic case study of using Japan as an example of natural population decrease, ‘stage 5’ of the demographic transition and all the problems that come with? Well, take a look at Japan’s population with one of the Slowdown graphs (Figure 28), and you’ll see with the help of Danny’s annotations – Japan has experienced this demographic shift plenty of times before! Japan’s population continues to age and decrease because they don’t attract migrants as much as say, the USA. The USA is an outlier in western terms because it’s population is still increasing at a fair rate, due to attracting migrants because of its economic success, with the availability of jobs at the bottom that are low paid. Japan not so much, and coupled with fewer pull factors it doesn’t attract many migrants to bolster its population.
I had a go replicating these plots on Gapminder Tools. And what strikes me is that we had the ability to see the data in this way all along – but it’s taken the insight and thinking of Danny to make us aware of looking at it. He certainly has an eye for this stuff, doesn’t he! 😉
Just a word of caution if you want to do the same on Gapminder Tools. I had to manipulate the axes using the advanced options and for some reason, this led to my computer’s CPU ticking highly and crashing my browser. I’ll try again later using the downloadable offline version of Gapminder tools. So haven’t been able to get you a screenshot of my attempts just yet!
Danny took us through more graphs from GDP, the stock exchange, species extinction etc – but I won’t take the fun away by commenting here – just go explore at the graphs yourself via the website – find out what is slowing down, and what is speeding up. Also, check out the COVID-19 tab on the website for a refreshing look at the data, rather than the now-dreaded (albeit insightful) John Hopkins GIS map.

I’m also putting the book on my wish-list!
Final thoughts
I’m going to engage in a bit of self-care here – I did fully intend to put some tweets in of reactions and thoughts from others attending sessions in the other pathways, but do need a good night’s sleep! I saw a lot of great things posted on Twitter, such as engaging Geography through Asian culture and music and the talented Katie Hall weaving GIS and Rosenshine Principles together. So the best thing to do here is simply to browse through the tagged #GAeConf20 tweets on Twitter and indulge yourself. And of course, look forward to the collation of recordings and resources on the GA website.
But… wow… What can I say but well done to The GA for pulling this remote conference off in challenging circumstances. It was a baptism of fire and I know that the team will ensure they take on all feedback and evaluate what went well and what lessons they can learn to perhaps integrate some of the online/remote features into future conferences. As I said yesterday – it kept me sane by ensuring I still felt part of a wonderful community of brilliant people. Teachers – I hope you felt valued and supported by participating in the conference. You’re all heroes. I can’t wait to see you all next year.
All my education work via Geogramblings is done all in my spare time, at my own cost but is free for you to access and enjoy. If you can spare a few pence, I’d be delighted if you could show your thanks by ‘buying me a coffee‘. Thank you! 🙂

2 thoughts on “‘GIS some more (GAeConf20 Part 3)”