Examples of climate and energy data visualisations and how they can be used in the classroom

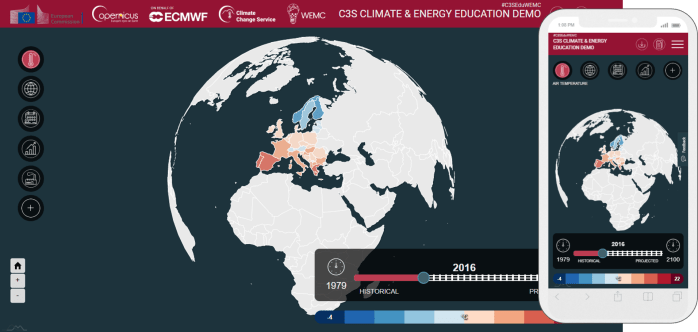
An article written for the World Energy and Meteorology Council (WEMC). It is becoming increasingly common place that education departments of governments around the world are including climate change in statutory policy. One such example is the recently released Sustainability and climate change: a strategy for the education and children’s services systems by the UK … Continue reading Examples of climate and energy data visualisations and how they can be used in the classroom

Advertisement

European award for Climate Change GIS! (and other teachable goodies)

Find out whether a GIS for schools using climate data which I helped develop won an award from Copernicus ECMWF. But also check out the other amazing nominations that a teachers could use in the classroom.

Visualise it

Visualisation is an important tool in promoting knowledge and understanding. Presented here are a number of visualisations that educators across curricula may enjoy and find useful. Featuring: @exploratorium, @cnscenter, @worldmapper, @NatGeoMag, @gapminder