Find out whether a GIS for schools using climate data which I helped develop won an award from Copernicus ECMWF. But also check out the other amazing nominations that a teachers could use in the classroom.
The Life Geographic: A somewhat self-absorbed personal and professional development blog of an ex-Geography high-school teacher…
Find out whether a GIS for schools using climate data which I helped develop won an award from Copernicus ECMWF. But also check out the other amazing nominations that a teachers could use in the classroom.

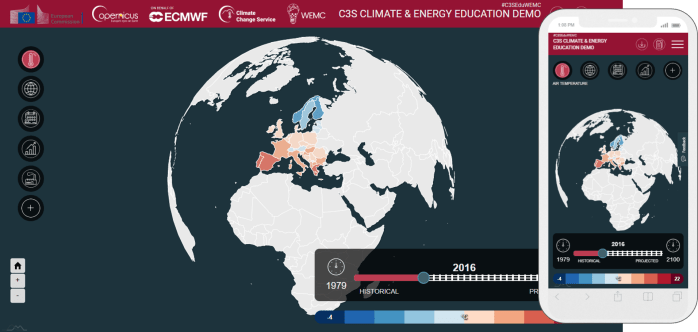
A 'mini' placement has me looking into a useful climate and energy visualisation tool. Calling for feedback on making it a potentially effective educational resource! Featuring: @WEMCouncil, @CopernicusECMWF

My final @The_GA #GAConf18 review. Inspiration all round: from adventurous geog teachers, passionate trainees, those who work behind the scenes and even, maths! Featuring: @FryRsquared, @DrGrovesGeog, @Re_Ferg, @THEWATERDIARIES, @LucyOxley

Visualisation is an important tool in promoting knowledge and understanding. Presented here are a number of visualisations that educators across curricula may enjoy and find useful. Featuring: @exploratorium, @cnscenter, @worldmapper, @NatGeoMag, @gapminder

NOAA's carbon cycle monitoring network is global, showcasing a range of landscapes. Here are some of my favourites.
